Why “No-Shows” in Medical Transport Are Costing Your Facility Thousands
Patient no-shows cost U.S. healthcare an estimated $150 billion every year — and a single missed appointment can cost your facility $200 or more in lost revenue. The single biggest controllable factor behind those numbers? Transportation. Here’s how facility administrators in Chesapeake, Norfolk, and Virginia Beach are recovering that revenue.
If you run a dialysis center, hospital discharge desk, skilled nursing facility, primary-care clinic, or outpatient rehab program in Hampton Roads, this number should stop you cold: a typical 5-provider practice loses roughly $192,000 per year to patient no-shows. For larger multi-physician operations, one documented clinic logged 14,000 no-shows in a single year — over $1 million in lost revenue.
What administrators often miss is why those patients didn’t show up. It’s rarely apathy, forgotten reminders, or fee phobia. Industry research consistently identifies transportation as one of the top three causes of missed appointments — and at On Time NEMT, we’d argue it’s #1 for the populations your facility serves most: dialysis patients, post-surgical discharges, seniors, and anyone managing a chronic condition that already makes driving difficult.
This guide walks facility leaders through the real cost of transportation-related no-shows, the math behind your specific exposure, why typical NEMT options keep failing, and the five-step action plan our healthcare partners across Chesapeake, Norfolk, and Virginia Beach use to plug the leak.
What’s In This Post
- The $150 Billion Problem: What No-Shows Really Cost
- Why Transportation Is the Hidden Driver
- The Math: What No-Shows Cost YOUR Facility
- By Facility Type: Where the Losses Hit Hardest
- The Real Consequences Beyond Revenue
- Why Typical NEMT Options Keep Failing
- A 5-Step Plan to Stop the Bleeding
- How On Time NEMT Partners with Virginia Facilities
- Frequently Asked Questions
The $150 Billion Problem: What No-Shows Really Cost
Industry analyses by the Medical Group Management Association (MGMA), Curogram, Artera, and Clearwave consistently land on the same headline figure: U.S. healthcare loses roughly $150 billion every year to patient no-shows. That’s not a typo. That’s larger than the entire annual GDP of more than 130 countries.
Broken down to the practice level, the numbers are just as sobering:
| Metric | Industry Average |
|---|---|
| Cost per single no-show | $200 – $375 |
| Average no-show rate (outpatient clinics) | 20% – 30% |
| Average no-show rate (NEMT industry) | 15% – 30% |
| Daily revenue loss for medical groups | ~14% |
| Annual loss — independent physician practice | ~$150,000 |
| Annual loss — 5-provider group practice | ~$192,000 |
| Practices reporting $2,500+ monthly loss | 47% |
Sources: MGMA, Curogram, Dialog Health, Artera, Solv Health, Clearwave (2024–2026 industry analyses).
What makes this number even worse is the compounding effect. Solv Health modeled a 5-provider practice with a 19% no-show rate and an average $200 visit value — the annual loss came to $192,000. Add fixed overhead (rent, payroll, utilities) that doesn’t go away when a chair sits empty, and the effective loss is closer to $300,000+ in a single year.
Why Transportation Is the Hidden Driver of No-Shows
Most no-show conversations focus on text reminders, scheduling friction, and cancellation fees. But the data tells a sharper story for the patient populations Hampton Roads facilities actually serve.
According to a February 2026 Uber Health survey of 150 healthcare professionals, more than half of respondents estimated that 11–20% of missed appointments are directly tied to transportation barriers. The NEMT industry’s own benchmarks suggest the share is even higher — between 25% and 30% of all missed medical appointments stem from transportation problems.
Layer in the demographic reality: nearly 4 million Americans miss or delay medical care every year because they lack transportation, according to the American Hospital Association. For Hampton Roads — with its large senior population, three major hospital systems, and Hampton Roads Transit’s limited paratransit coverage outside core neighborhoods — that share is higher, not lower, than the national average.

The patients most likely to no-show are the patients who need transport most
Look at the populations driving your facility’s no-show rate and a pattern emerges: the same patients who can’t drive themselves are the ones whose appointments are hardest to fill at the last minute. Dialysis patients. Stroke survivors. Post-surgical discharges. Adult day program participants. Hospice transfers. These aren’t patients who “forgot” — these are patients whose ride fell through.
For dialysis specifically, the consequences are devastating. A 2025 study published in the Clinical Journal of the American Society of Nephrology found that hemodialysis patients who use Medicaid transportation miss three times more treatments than those with private transportation. And when dialysis patients miss treatments due to transportation failures, hospitalization rates climb from 0.58 per year to 2.1 per year — a 260% increase in downstream costs that ultimately route back to your facility, your hospital network, and your payer mix.
The Math: What No-Shows Cost Your Specific Facility
You don’t need a consulting engagement to size your exposure. Here’s the formula every facility administrator should run quarterly:
Plug in some realistic Hampton Roads numbers:
| Facility Profile | Daily Appts | No-Show Rate | Est. Annual Loss |
|---|---|---|---|
| Solo primary-care practice | 25 | 15% | ~$187,500 |
| 3-provider specialty clinic | 60 | 20% | ~$600,000 |
| Dialysis center (12-chair) | 36 | 8% | ~$144,000 |
| Outpatient rehab clinic | 40 | 22% | ~$440,000 |
| Skilled nursing facility (transport-out) | 8 | 18% | ~$72,000 |
Calculated at 250 operating days/year and an average $200 visit value. Specialty clinics and infusion centers typically run higher per-visit values, multiplying the loss.
The takeaway: even a “small” 5-point reduction in your no-show rate — say, 20% down to 15% — typically returns five to six figures annually for a mid-sized facility. That’s the gap that reliable transportation closes.
By Facility Type: Where the Transportation Losses Hit Hardest
Transportation-driven no-shows don’t hit every facility equally. Here’s what we see across the facilities On Time NEMT partners with in Chesapeake, Norfolk, and Virginia Beach:
💧 Dialysis Centers
Patients require dialysis transportation three times per week for years. A single missed treatment can trigger ER admission. Standing-order recurring rides are the single highest-ROI fix.
🏥 Hospital Discharge Planning
Discharge delays cost hospitals roughly $1,400 per bed-day. When the patient’s ride doesn’t arrive, the bed sits, the next admission stalls, and Medicare DRG margins evaporate.
🧠 Outpatient Rehab & PT
Stroke and post-surgical patients need consistent therapy windows. Missed PT sessions extend recovery, lower outcome scores, and drag down value-based care metrics.
🛏️ Skilled Nursing Facilities
Residents need consistent rides to specialists, dialysis, and imaging. Without a reliable transport partner, the facility’s labor cost balloons as staff scramble to chase last-minute rides.
🎗️ Oncology & Infusion Centers
Chemo and infusion slots are high-revenue, high-staff-intensity, and almost impossible to refill last-minute. Even small no-show rates compound into massive losses.
🤝 Adult Day Programs
These programs depend on consistent daily attendance to maintain census, billing, and family caregiver relief. Transport reliability is operational survival.
The Real Consequences Beyond the Lost Revenue
Revenue is the headline, but it’s not the whole story. Every transportation-driven no-show creates a chain reaction that costs your facility in ways that don’t always show up on a P&L.
Clinical Outcomes Decline
Missed dialysis, chemo, and rehab sessions worsen conditions and increase readmissions. Patients who no-show even once are 70% more likely not to return within 18 months.
Quality Metrics Suffer
HEDIS, Star Ratings, and value-based contracts all penalize missed care. Transportation-driven no-shows pull these scores down — and that affects reimbursement.
Staff Burnout Rises
Front-desk and case management teams spend hours rebooking, chasing rides, and apologizing to providers. That admin churn is one of the leading drivers of clinical staff turnover.
Patient Satisfaction Tanks
When a patient’s ride doesn’t show up and they miss care, they blame the facility — not the transport company. Your reviews suffer for someone else’s failure.
Downstream Costs Multiply
Missed primary care turns into ER visits. Missed dialysis turns into hospitalizations. Missed PT turns into permanent disability claims. The bill always lands somewhere.
Patient Retention Drops
Patients who feel like the system failed them once are more likely to switch providers, delay future care, or disengage entirely. Lifetime value evaporates.
Why Typical NEMT Options Keep Failing Hampton Roads Facilities
If transportation is the problem, the obvious answer is “use an NEMT broker or rideshare program.” Except those options are precisely what’s creating the 15–30% NEMT no-show rate the industry sees today.
The Medicaid broker problem
Medicaid-funded NEMT in Virginia is administered through managed care organizations and third-party brokers. Brokers prioritize volume and cost-per-trip, not reliability. Drivers are routed across enormous service areas. Patients are routinely overbooked or assigned drivers who never arrive. When a ride fails, the broker’s only consequence is a denied claim — your facility’s consequence is a missed appointment, a lost revenue slot, and a frustrated patient.
The rideshare-as-NEMT problem
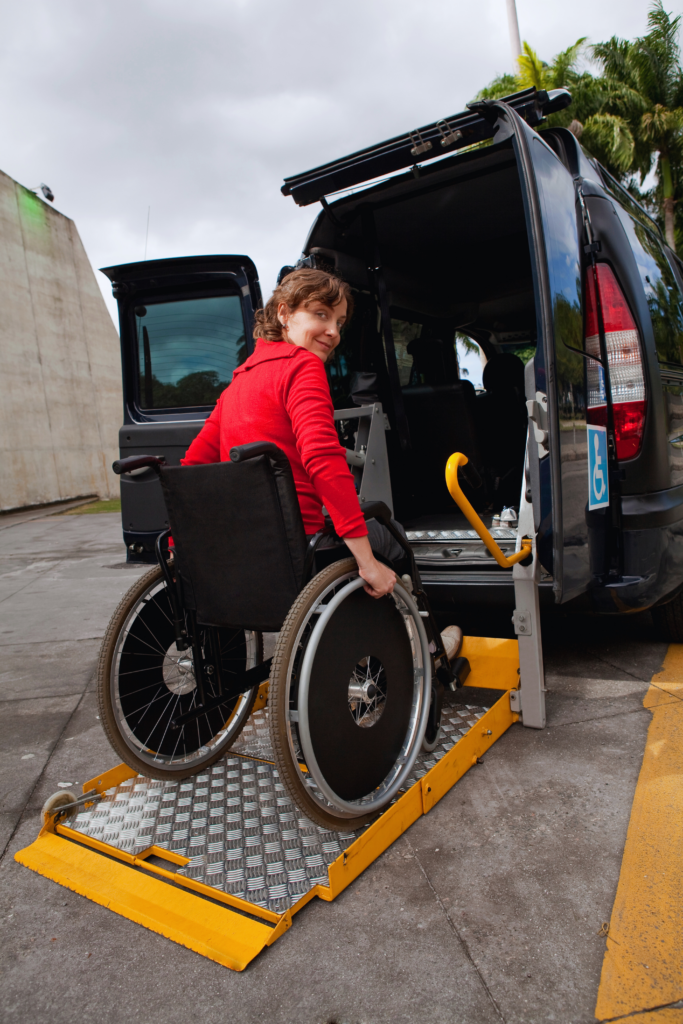
Uber Health, Lyft Healthcare, and similar platforms work great for ambulatory patients with smartphones. For the patient populations most likely to no-show — seniors, mobility-impaired patients, post-surgical discharges, anyone needing wheelchair or stretcher transport — rideshare is structurally incompatible with their needs. No door-to-door assistance. No wheelchair lifts. No stretcher service. No driver who’s trained to help.
The “we have a contract with a national vendor” problem
Many large healthcare systems hold NEMT contracts with national vendors that subcontract to local operators of varying quality. The vendor delivers a dashboard; the patient gets whatever driver showed up that day. There’s no accountability loop, no local relationship, and no incentive to perform once the contract is signed.
| Capability | Typical NEMT Broker / Rideshare | On Time NEMT (Private Pay) |
|---|---|---|
| On-time arrival commitment | No SLA — overbooked routinely | On time, every time — guaranteed |
| Wheelchair-accessible vehicles | Limited / inconsistent | ADA-compliant vans, full fleet |
| Stretcher transport | Rarely offered | Yes — bed-to-bed service |
| Door-to-door assistance | Curb-to-curb only | Door-to-door, every ride |
| Recurring standing orders | Possible but unreliable | Built for dialysis & weekly rides |
| Local accountability | National call center | Local team, local drivers, one phone call |
| Facility billing | Complex broker invoices | Direct facility billing available |
A 5-Step Plan to Stop the Bleeding
Here’s the exact framework On Time NEMT walks facility administrators through when they want to reduce transportation-driven no-shows in 90 days or less.
Audit your current no-show rate by appointment type
Pull 90 days of scheduling data and segment by visit type. Most facilities discover that dialysis, PT, and post-op follow-ups are 2–3x the practice-wide average — and those are precisely the visit types where transportation is the problem, not the patient.
Survey 25 no-show patients on the actual reason
Don’t guess. Have your front desk call 25 recent no-show patients and ask one question: “What stopped you from making it that day?” In our experience, “ride didn’t come” or “couldn’t get there” tops the list for chronic-care visit types.
Establish a vetted, single-source transportation partner
Stop relying on patient-supplied transportation. Establish a relationship with a local, accountable NEMT provider who can quote a flat rate, handle wheelchair and stretcher needs, and set up standing orders for recurring patients.
Build transportation into the appointment workflow
At the moment of scheduling, ask: “Do you have a reliable ride?” If not, hand them a card with your NEMT partner’s number or — better — book the ride yourself directly through a facility account. This single workflow change cuts no-shows in half for most clinics.
Measure, iterate, and protect the gain
Track your no-show rate monthly. Compare quarter-over-quarter. When you see the rate drop 5–10 points, calculate the recovered revenue and make sure leadership sees the number. That’s the business case for keeping the transportation partnership in place — and expanding it.
How On Time NEMT Partners with Virginia Facilities
On Time NEMT is locally based at 3837 Larchwood Drive in Virginia Beach. We’re not a national platform, a Medicaid broker, or a rideshare app. We’re a Hampton Roads NEMT company built around one operating principle: on time, every time.
For facility administrators, that means:
- Direct facility accounts — book rides for your patients without putting the burden on them
- Standing orders for recurring trips — set up dialysis, PT, and weekly appointment schedules once and never call again
- Wheelchair, ambulatory, and stretcher service — see our stretcher service page for bed-to-bed details
- Transparent flat-rate pricing — view our public pricing page with no hidden fees
- Door-to-door, never curb-to-curb — drivers walk patients in, sign discharge forms, and confirm arrival
- Long-distance coverage up to 240 miles — including long-distance NEMT to VCU, UVA, and beyond
- One local phone number, one local team — call 1-757-440-3015 and talk to a real person
We currently serve all three major Hampton Roads cities — and we’re rapidly expanding across the rest of Virginia.
Frequently Asked Questions
Answers to the questions facility administrators ask most.
How much does a single patient no-show cost a medical facility?
What percentage of medical no-shows are caused by transportation problems?
How much do no-shows cost the U.S. healthcare system annually?
What is the no-show rate for NEMT transportation?
Can a Hampton Roads facility set up a recurring transportation account with On Time NEMT?
Do you serve facilities outside Hampton Roads?
How quickly can a facility get a recurring transportation account set up?
What types of transportation does On Time NEMT offer?
Related Resources for Facility Administrators
Stop Losing Revenue to Transportation No-Shows
If your facility loses even $5,000 a month to no-shows, the math on a transportation partner is obvious. Set up an On Time NEMT facility account in 24 hours and watch your no-show rate drop in your next reporting cycle.
Or call us directly: 1-757-440-3015On Time NEMT · 3837 Larchwood Drive, Virginia Beach, VA 23456 · Proudly serving Chesapeake, Norfolk, Virginia Beach, and beyond.